Using D3, backbone and tornado to visualize histograms of a csv file
After being procrastinating for weeks the learning of D3.js and backbone.js I have finally made my first example using both libraries to explore (via histograms) a pandas DataFrame. The reason of the procrastination is very simple: I love python to much, because is probably the only language who is great in all areas (that I am interested at least):
- Great web frameworks as Django and Tornado - “fighting” with ruby (rails)
- Great Data analysis packages such as pandas - “fighting” with R
- Great machine-learning libraries such as scikit-learn
- Probably not the most successful but has a good gaming library pyGame
- Is a great general purpose language - I use it to program a robot for a NASA competition using a PS3 controller, serial-ports, web-server, cameras, and all in one language
- And the list could go for hours
For me that is the python killer feature: do anything on one language, sometimes the community is not big enough and is necessary the help of a genius like Wes Mckinney to create pandas but in general the community is great.
The Javascript community is in a similar condition everyday new libraries come up and change how people do stuff, such as D3.js changed how people do interactive visualizations.
So I finally got out of my python comfort zone and re-learn Javascript, I had used it but was very simple examples using JQuery and a very long time ago, everything has changed now the cool people use Backbone.js which is a fabulous creation to give structure to Javascript. So I read a lot of beginner tutorials of backbone and D3 and this is the result.
What I wanted
For copper, my python data analysis library, I use matplotlib to plot histograms like this:
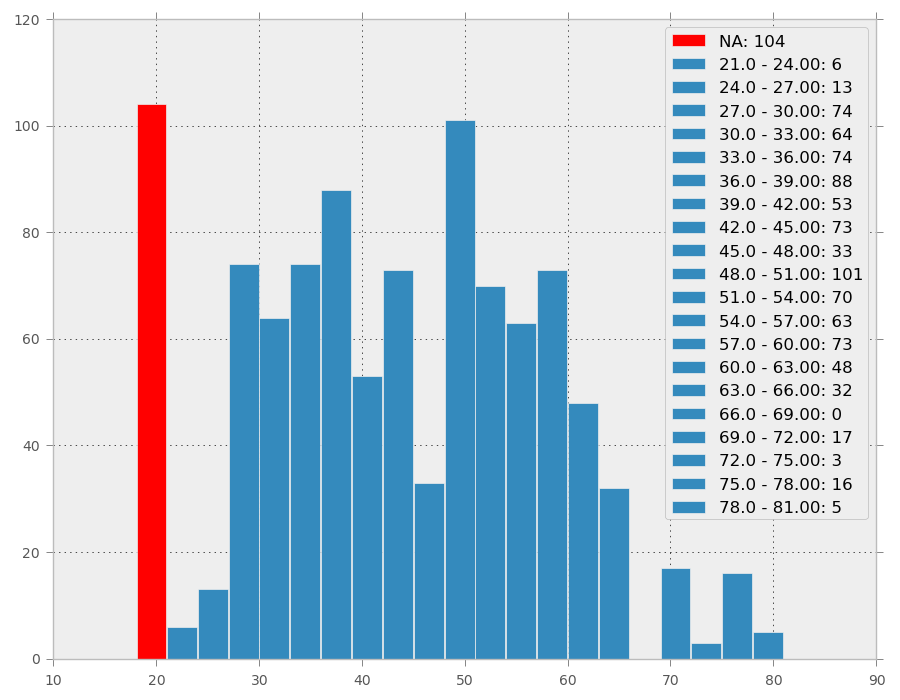
The histograms work and are great so I wanted to do the same with D3.js to explore a csv file using pandas.
Data - I am using data from a Business Intelligence project I am currently working on, available here: expedia.csv
Python: REST API
To use backbone is necessary to have a RESTful API, I select Tornado and pandas to do that I was tempted to use node but at the end of the day I want to keep adding features to copper. The API is the following:
/columnsreturns a list of the columns of thecsvfile/hist/{id}return necessary data of the columnsidto create the histogram
Some relevant code:
class HistogramHandler(tornado.web.RequestHandler):
    def get(self, col_id):
        df = pd.read_csv('explore.csv')
        col = df[df.columns[int(col_id)]]
        nans = int(len(col) - col.count())
        col = col.dropna()

        ans = {}
        ans['col_name'] = col.name
        ans['nans'] = nans
        ans['values'] = col.values.tolist()
        self.write(json.dumps(ans))

application = tornado.web.Application([
    (r"/", MainHandler),
    (r"/hist/([0-9]+)", HistogramHandler),
    (r"/columns", ColumnsHandler),
], debug=True, **settings)
calling /columns returns this:
[{"id": 0, "name": "x1"}, {"id": 1, "name": "x2"}, ... , {"id": 39, "name": "x40"}, {"id": 40, "name": "depend"}]calling /hist/2 returns this:
{"col_name": "x3", "values": [3.0, 4.0, 4.0, ... , 2.0, 4.0], "nans": 102}Javascript: UI + Graphics
For backbone I mainly read this article on cascading selects. But I use only one select (for now) and use the underscore templates.
To make the <select>'s good better I am using a js library called chosen which is really good and simple to use.
For D3 I follow the main histogram example and added a red column to show missing values and hard-code it a little bit more to make changes easier.
Finally I create another Model and View to control the number of bins dynamically.
The complete Javascript including backbone and D3 code is this:
$(function () {
  var ColumnListItem = Backbone.Model.extend();
  var ColumnList = Backbone.Collection.extend({
    url: "/columns",
    model: ColumnListItem,
  });

  var ColumnListView = Backbone.View.extend({
    initialize: function () {
      _.bindAll(this, "addOne", "addAll");
      this.collection.bind("reset", this.addAll);
    },

    addOne: function (column) {
      // column is a ColumnListItem model
      var variables = { id: column.get("id"), name: column.get("name") };
      var template = _.template($("#option_template").html(), variables);
      $(this.el).append(template);
    },

    addAll: function () {
      this.collection.each(this.addOne); // For each item in the collection call addOne
      $(".chzn-select").chosen();
    },

    events: {
      change: "changeSelectedItem",
    },

    changeSelectedItem: function (evt) {
      histogramData.set("id", $(this.el).val());
      histogramData.fetch();
    },
  });

  var NumberBins = Backbone.Model.extend({
    defaults: {
      bins: 20,
    },
  });
  var NumberBinsView = Backbone.View.extend({
    events: {
      change: "changeValue",
    },
    changeValue: function (event) {
      this.model.set("bins", parseInt(this.$el.val()));
    },
  });

  var HistogramData = Backbone.Model.extend({
    urlRoot: "/hist",
  });

  var ChartView = Backbone.View.extend({
    initialize: function () {
      this.model.get("histogramData").bind("sync", this.render, this);
      this.model.get("numberBins").bind("change", this.render, this);
    },

    render: function () {
      this.$el.html("");
      var histData = this.model.get("histogramData").toJSON();
      if (histData.id == undefined) {
        return this;
      }
      var nbins = this.model.get("numberBins").toJSON().bins;

      var width = 960;
      var height = 500;
      var padding = { top: 15, right: 15, bottom: 25, left: 30 };

      var values = histData.values;
      var data = d3.layout.histogram().bins(nbins)(values);

      var xmin = d3.min(data, function (d) {
        return d.x;
      });
      var xmax = d3.max(data, function (d) {
        return d.x + d.dx;
      });
      var ymax = d3.max(data, function (d) {
        return d.y;
      });
      ymax = Math.max(histData.nans, ymax);
      var xScale = d3.scale
        .linear()
        .domain([xmin, xmax])
        .range([padding.left, width - padding.right]);
      var yScale = d3.scale
        .linear()
        .domain([0, ymax])
        .range([height - padding.bottom, padding.top]);

      var barWidth = xScale(data[1].x) - xScale(data[0].x) - 1;

      var svg = d3.select(this.el).append("svg").attr("width", width).attr("height", height);

      if (histData.nans > 0) {
        xScale = d3.scale
          .linear()
          .domain([xmin, xmax])
          .range([padding.left + barWidth, width - padding.right]);
        barWidth = xScale(data[1].x) - xScale(data[0].x) - 1;

        yNans = histData.nans;
        svg
          .append("g")
          .attr("class", "bar-nans")
          .attr("transform", function (d) {
            return "translate(" + (padding.left + 2) + "," + yScale(yNans) + ")";
          })
          .append("rect")
          .attr("width", barWidth - 1)
          .attr("height", height - yScale(yNans) - padding.bottom);
      }

      var bar = svg
        .selectAll(".bar")
        .data(data)
        .enter()
        .append("g")
        .attr("class", "bar")
        .attr("transform", function (d) {
          return "translate(" + xScale(d.x) + ", " + yScale(d.y) + ")";
        });

      bar
        .append("rect")
        .attr("class", "hint hint--top")
        .attr("data-hint", "hober me")
        .attr("data-placement", "top")
        .attr("data-content", "Vivamus sagittis lacus vel augue laoreet rutrum faucibus.")
        .attr("width", barWidth)
        .attr("height", function (d) {
          return height - yScale(d.y) - padding.bottom;
        });

      // Axis
      var xAxis = d3.svg.axis().scale(xScale).orient("bottom");

      var yAxis = d3.svg.axis().scale(yScale).orient("left").ticks(5);

      svg
        .append("g")
        .attr("class", "x axis")
        .attr("transform", "translate(0," + (height - padding.bottom) + ")")
        .call(xAxis);
      svg
        .append("g")
        .attr("class", "y axis")
        .attr("transform", "translate(" + padding.left + ",0)")
        .call(yAxis);
      return this;
    },
  });

  var ChartModel = Backbone.Model.extend();

  var columnsList = new ColumnList();
  var columnsListView = new ColumnListView({ el: $("#column-select"), collection: columnsList });

  var numberBins = new NumberBins();
  var numberBinsView = new NumberBinsView({ el: $("#num-bins"), model: numberBins });

  var histogramData = new HistogramData();
  var chartModel = new ChartModel({ histogramData: histogramData, numberBins: numberBins });
  var chartView = new ChartView({ el: "#chart", model: chartModel });

  columnsList.fetch();
});
Conclusion
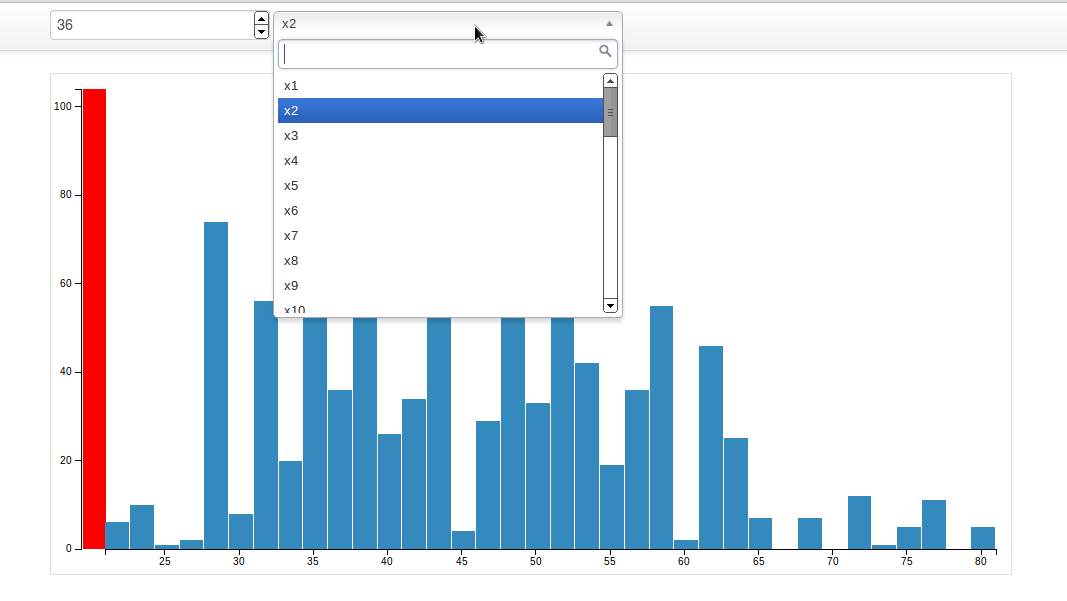
Changing the number of bins or the column automaticlly re-draws the histogram.
It was hard for me to use javascript again. Learning backbone was even harder but I think I am finally understanding it, definitely the best way is to learn it is to take baby steps and read a lot. D3 wasn’t that hard, is a very good library.
I include the whole code on copper (my data analysis package) which is not yet available via pip, so to use this need to download the explore folder of the package and run python explore.py (requires tornado and pandas). Remember to change the explore.csv to explore other data.