Python Finance Package v0.02: Basic Utils and Market Simulator
Continuing with the (Basic) Python Finance Package. Now has some basic utils: total-return, daily-returns, and sharpe-ratio calculations. Also a Market Simulator, the purpose was to solve the Computational Investing Homework 3.
Changes on DataAccess
- Now the index of the DataFrame is DatetimeIndex not string. With this is possible to index it with datetimes.
- Moved the classes folder from ’./data/’ to ’./utils/’
- Improved Documentation
Market Simulator
Reads a .csv file with the orders/trades. Downloads the necessary data (symbols and dates between the ). Makes a simulation of the orders:
The .csv file looks like this:
year,month,day,symbol,action,num_of_shares
2011,1,10,AAPL,Buy,1500
2011,1,13,AAPL,Sell,1500
2011,1,13,IBM,Buy,4000
2011,1,26,GOOG,Buy,1000
2011,2,2,XOM,Sell,4000
2011,2,10,XOM,Buy,4000
2011,3,3,GOOG,Sell,1000
2011,3,3,IBM,Sell,2200
2011,6,3,IBM,Sell,3300
2011,5,3,IBM,Buy,1500
2011,6,10,AAPL,Buy,1200
2011,8,1,GOOG,Buy,55
2011,8,1,GOOG,Sell,55
2011,12,20,AAPL,Sell,1200
How to use it:
- Set the initial amount of cash
- Run the simulation, as an argument give the path to the csv file
- See the the information
from finance.sim import MarketSimulator

sim = MarketSimulator()
sim.initial_cash = 1000000
sim.simulate("MarketSimulator_orders.csv")
print(sim.portfolio[0:10])

import matplotlib
matplotlib.use('Qt4Agg')  # Probably most people dont need this line
import matplotlib.pyplot as plt
sim.portfolio.plot()
plt.show()
Output:
              Portfolio
  Date
  2011-01-10  1000000
  2011-01-11   998785
  2011-01-12  1002940
  2011-01-13  1004815
  2011-01-14  1009415
  2011-01-18  1011935
  2011-01-19  1031495
  2011-01-20  1031935
  2011-01-21  1030775
  2011-01-24  1046815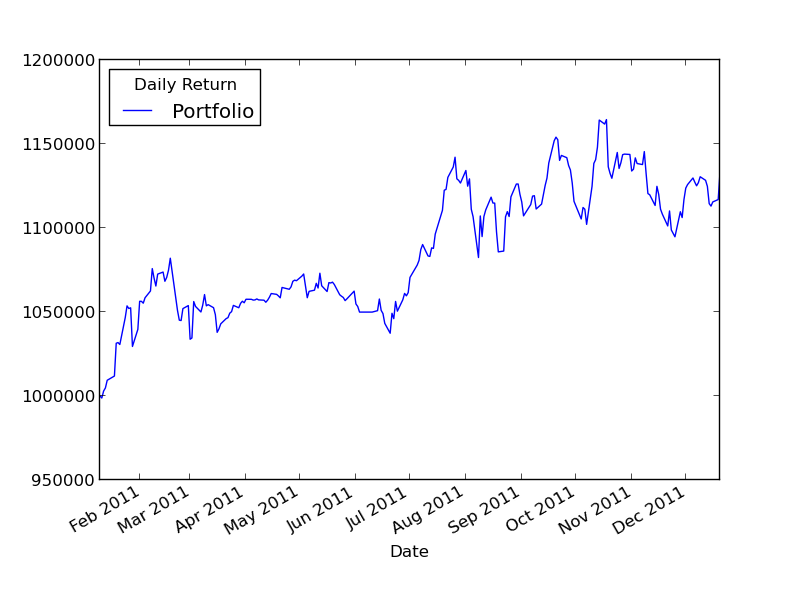
Basic Utils
With the portfolio ready we can get some info about it, for example the total return and sharpe ratio.
print('Total Return:', total_return(sim.portfolio, 'Portfolio'))
print(sharpe_ratio(sim.portfolio, extraAnswers=True))
Which prints:
Total Return: 0.1338600000000001

{'std': 0.0071901402219816928, 'sharpe_ratio': 1.1836398092874625, 'mean': 0.0005493527495690362}
Conclusion
Next step is to implement an Event Profiler to solve Homework 4.
Where to find the code? On github: PythonFinance